DATA ANALYST

Turning
Complex Data
Into Actionable
Insights

Hi, I'm Sandeep Koduru

Actively looking for opportunities
Sandeep Koduru, Data Analyst
Sandeep Koduru
DATA ANALYST • SQL EXPERT • POWER BI SPECIALIST • PYTHON BASICS • DATA MODELING • DAX • ETL PIPELINES • TABLEAU • MACHINE LEARNING • STORYTELLING WITH DATA • DATA ANALYST • SQL EXPERT • POWER BI SPECIALIST • PYTHON BASICS • DATA MODELING • DAX • ETL PIPELINES • TABLEAU • MACHINE LEARNING • STORYTELLING WITH DATA • DATA ANALYST • SQL EXPERT • POWER BI SPECIALIST • PYTHON BASICS • DATA MODELING • DAX • ETL PIPELINES • TABLEAU • MACHINE LEARNING • STORYTELLING WITH DATA • DATA ANALYST • SQL EXPERT • POWER BI SPECIALIST • PYTHON BASICS • DATA MODELING • DAX • ETL PIPELINES • TABLEAU • MACHINE LEARNING • STORYTELLING WITH DATADATA ANALYST • SQL EXPERT • POWER BI SPECIALIST • PYTHON BASICS • DATA MODELING • DAX • ETL PIPELINES • TABLEAU • MACHINE LEARNING • STORYTELLING WITH DATA • DATA ANALYST • SQL EXPERT • POWER BI SPECIALIST • PYTHON BASICS • DATA MODELING • DAX • ETL PIPELINES • TABLEAU • MACHINE LEARNING • STORYTELLING WITH DATA • DATA ANALYST • SQL EXPERT • POWER BI SPECIALIST • PYTHON BASICS • DATA MODELING • DAX • ETL PIPELINES • TABLEAU • MACHINE LEARNING • STORYTELLING WITH DATA • DATA ANALYST • SQL EXPERT • POWER BI SPECIALIST • PYTHON BASICS • DATA MODELING • DAX • ETL PIPELINES • TABLEAU • MACHINE LEARNING • STORYTELLING WITH DATA

My Philosophy

The Manifesto

Curiosity first, evidence always — a live look at how I measure my own craft.

12.4M

Rows Analyzed

DAXETLTableauPower BISQL
0+

Projects Completed

0+

SQL Queries Optimized

0+

Dashboards Built

0+

Data Models Created

01

Data-Driven Decisions

Every insight matters. I transform raw data into strategic intelligence that powers business growth and innovation.

01

Insight is just a good question away.

02

Precision & Performance

Optimizing queries, building efficient models, and creating dashboards that deliver results at scale.

02

Fast queries. Faster decisions.

03

Continuous Innovation

Staying ahead with cutting-edge analytics tools, automation workflows, and data visualization techniques.

03

Yesterday's toolkit is never enough.

04

Curiosity as a Craft

I ask 'why' until the data answers back. Every anomaly is a story, every outlier a lesson worth chasing.

04

Every outlier has a story to tell.

05

Storytelling with Numbers

Numbers don't move people — narratives do. I package insight into stories decision-makers can act on in seconds.

05

A number explained is a decision made.

Portfolio

Featured Projects

✓ Done
01Project 01

Manufacturing Analytics & Operational Dashboard

Comprehensive operational dashboard for manufacturing analytics. Complex data models, optimized SQL queries for large datasets, and interactive DAX-driven KPI visualizations in Power BI.

Technologies

SQLPower BIDAXData ModelingQuery Optimization
  • ▸Processed 100K+ records efficiently
  • ▸40% improvement in query performance
  • ▸Real-time KPI tracking dashboard

Impact

Enabled data-driven decision making for production planning
✓ Done
02Project 02

Social Media & User Engagement Analytics

End-to-end analytics solution for social media user engagement patterns. MySQL for database management, Python Pandas for data cleaning and transformation.

Technologies

SQLMySQLPythonPandasAdvanced Excel
  • ▸Analyzed 50K+ user interactions
  • ▸Identified top 10 engagement drivers
  • ▸Automated reporting workflows

Impact

Increased user engagement by 25% through data insights

✓ Done
03Project 03

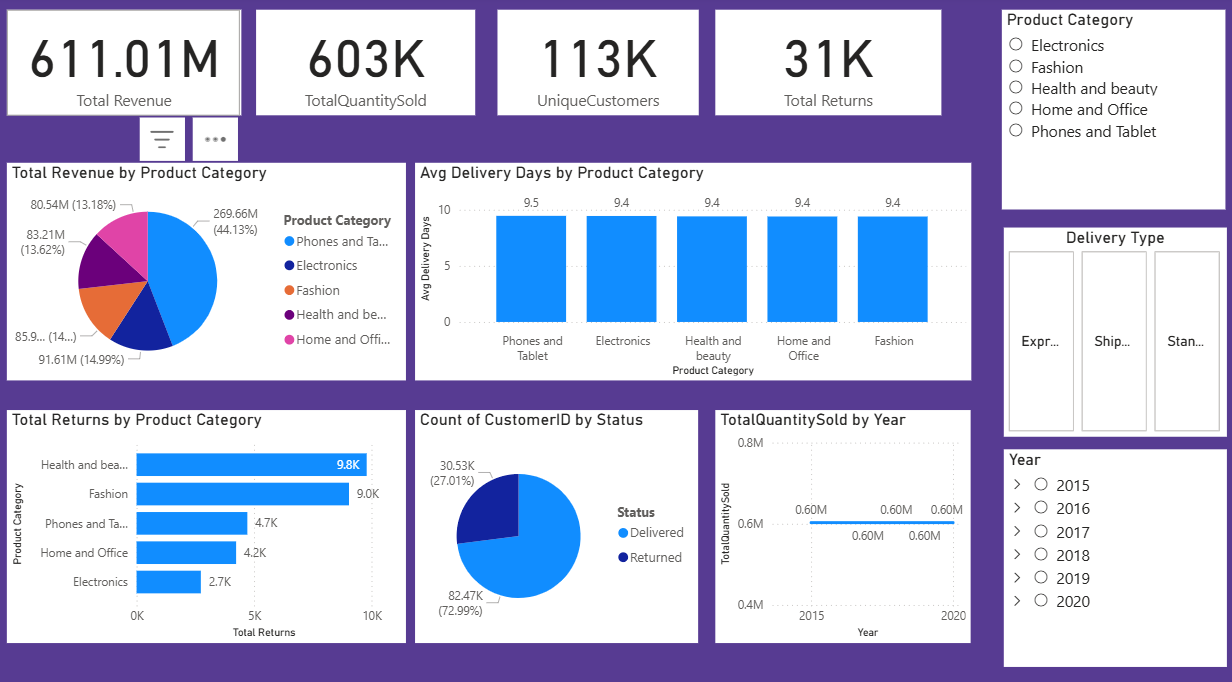
E-Commerce Revenue & Returns Intelligence

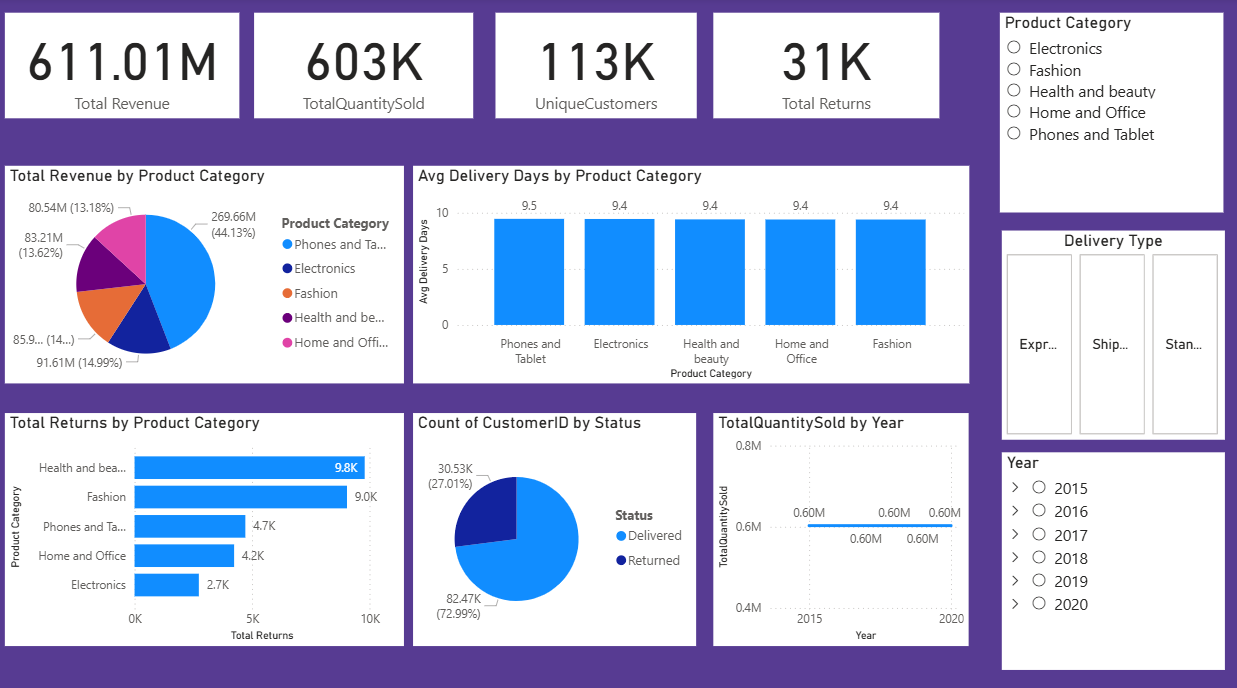
Executive KPI dashboard tracking revenue, unique customers, quantity sold, and returns across product categories, delivery types, and years.

Technologies

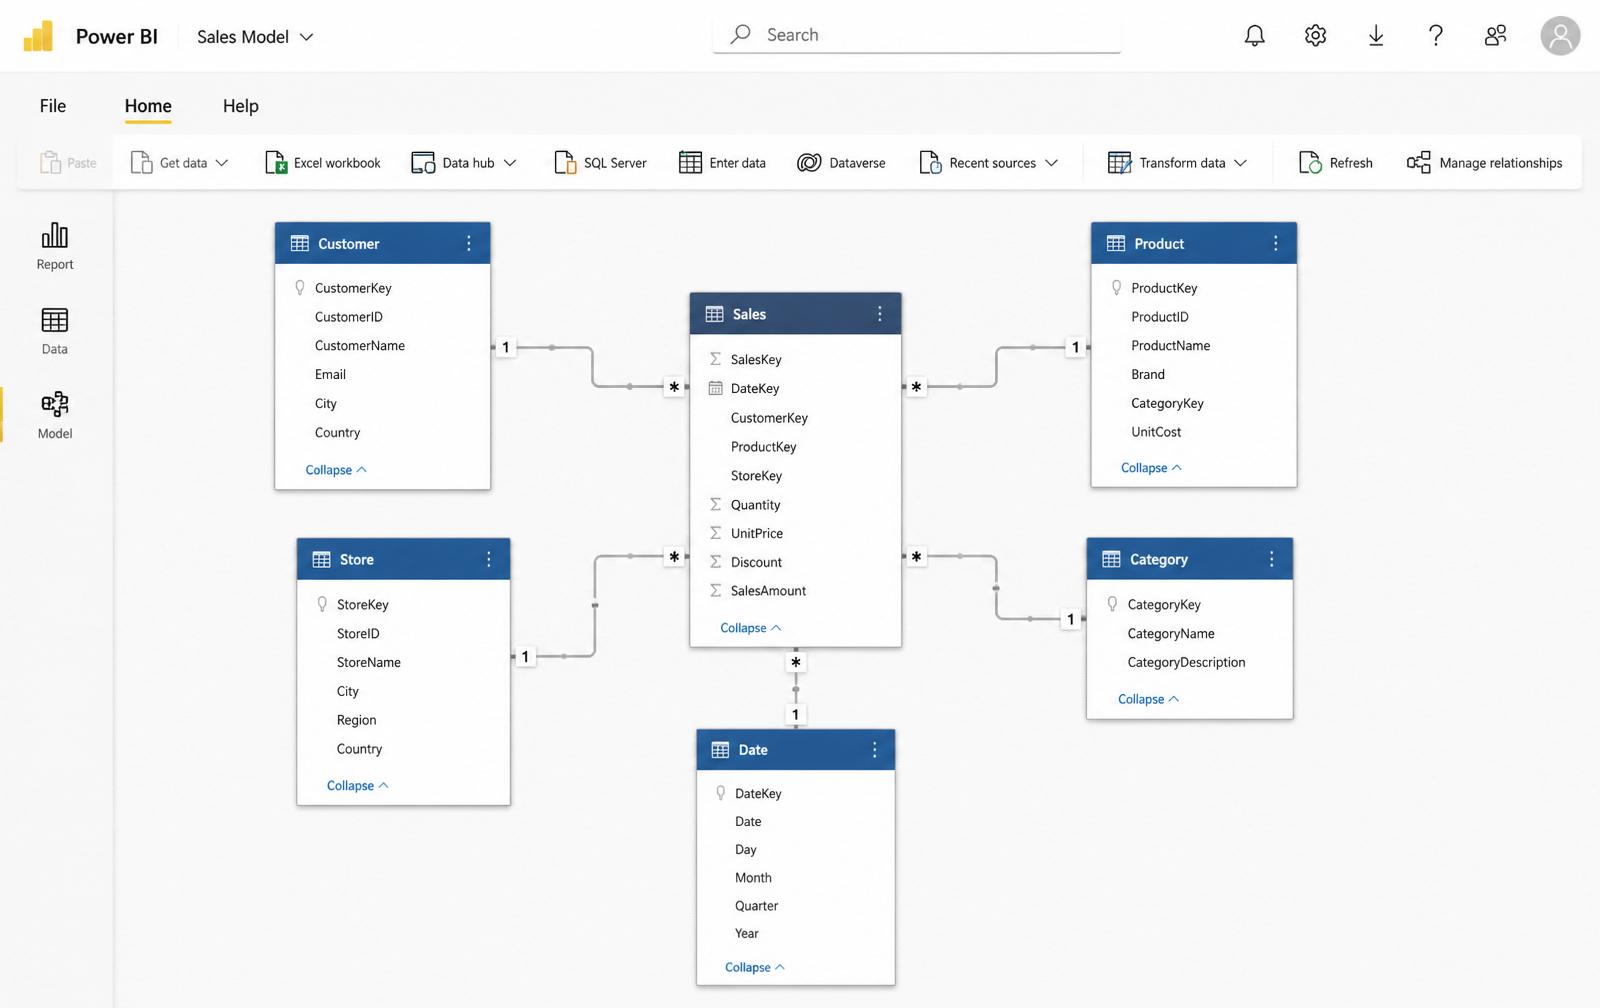
Power BIDAXPower QuerySQLStar Schema
  • ▸Tracked 611M+ in revenue across 6 years
  • ▸Reduced return rate visibility to 24 hours
  • ▸Slicer-driven category deep-dive

Impact

Gave leadership a single pane of glass for revenue health

✓ Done
04Project 04

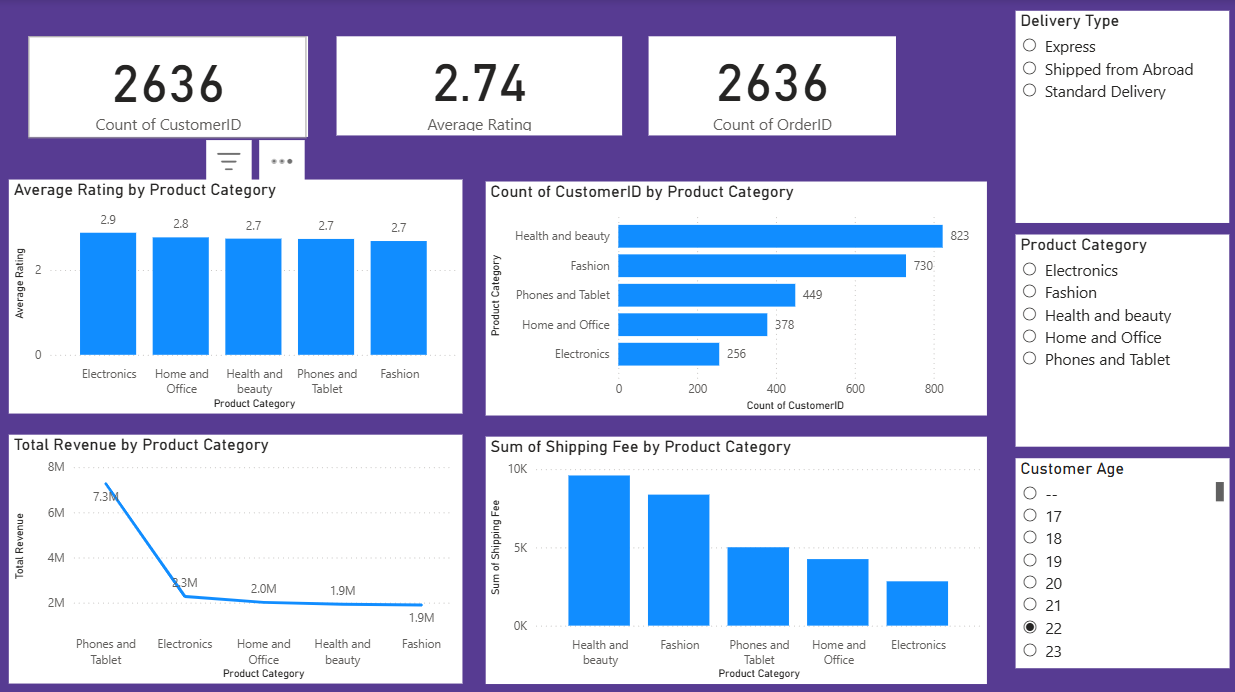
Customer Insights & Rating Analytics

Segment-level view combining customer counts, average ratings, and shipping fees across categories with age and delivery-type slicers.

Technologies

Power BIDAXExcelData Modeling
  • ▸Profiled 2.6K+ customer orders
  • ▸Surfaced low-rating categories to fix
  • ▸Age + delivery cohort analysis

Impact

Prioritized CX fixes by rating × revenue impact

Curiosity Note

"Data doesn't lie — but it stays silent until someone asks the right question."

Case Studies

Dashboards Slideshow

A walkthrough of dashboards I've built — the analysis behind each number and the engineering behind each pixel.

01 / 06
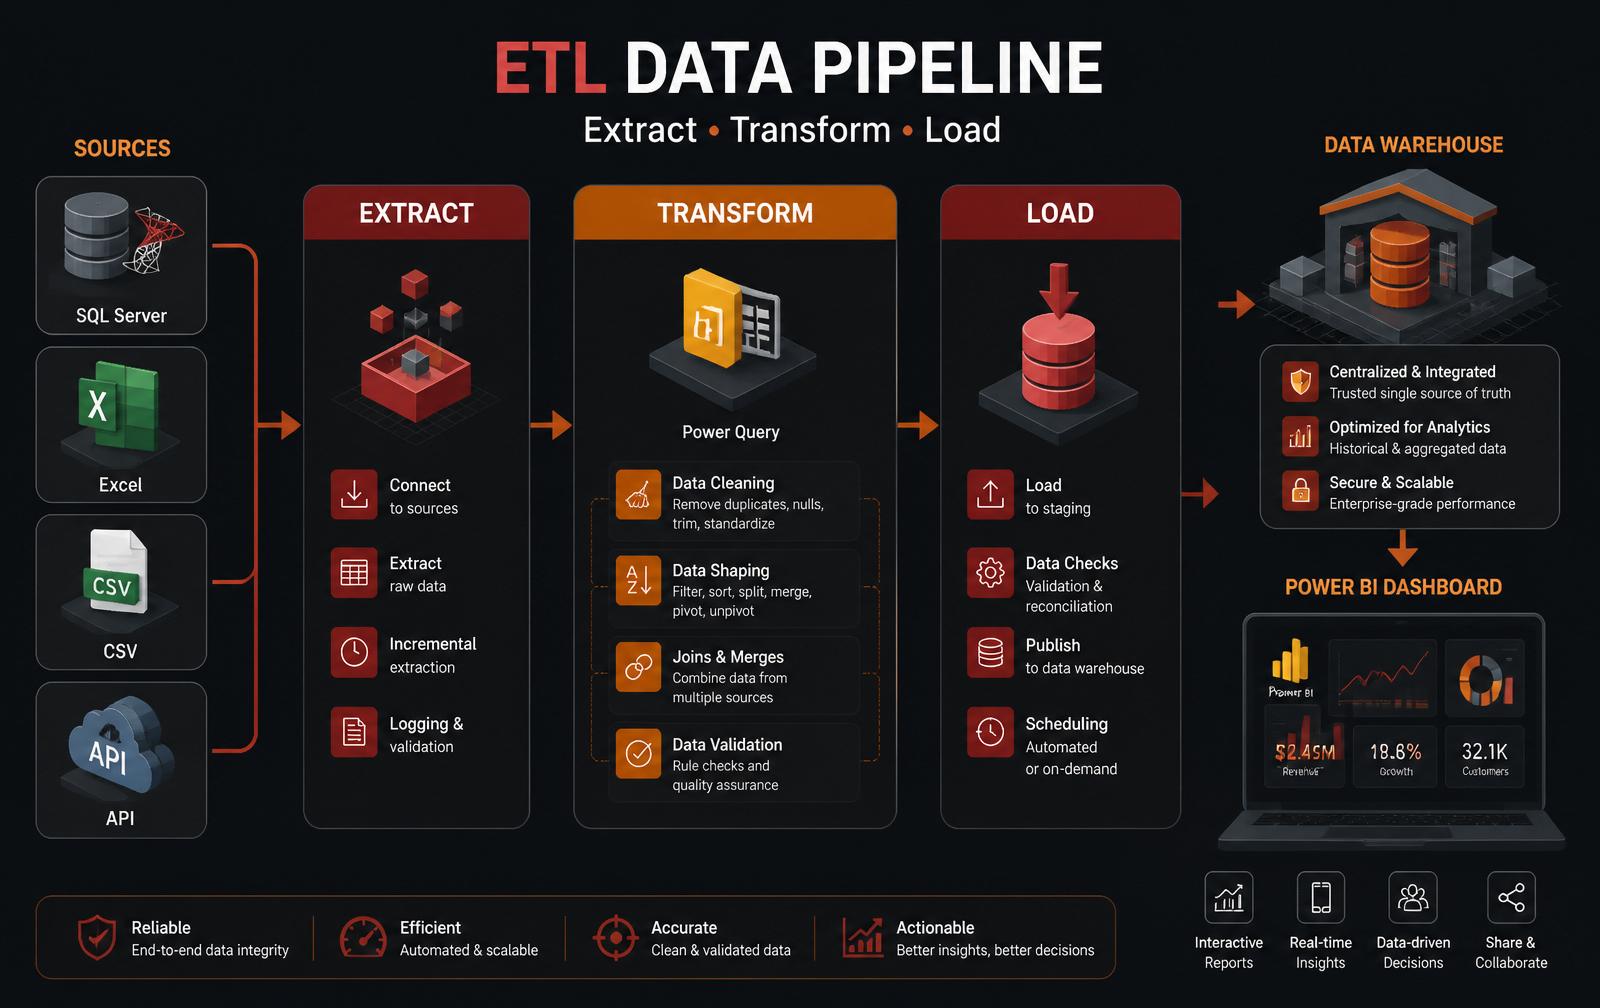
E-Commerce Revenue DashboardCustomer & Order Behavior Deep-DiveMulti-Category Performance ReportEnd-to-End ETL ArchitectureStar Schema Relationships in Power BIPython, Pandas & Automation
Slide 01 — Sales Analytics

E-Commerce Revenue Dashboard

Executive-level KPI dashboard tracking revenue, unique customers, quantity sold, and returns across product categories, delivery types, and years.

611.01M
Total Revenue
603K
Quantity Sold
113K
Unique Customers
31K
Total Returns

Curiosity Note

"Numbers are cheap. Conviction built on numbers is priceless."

Get In Touch

Let's Work Together

Have a project in mind? Reach out directly — let's discuss how I can turn your data into actionable insights.